Are out-of-date dashboard tools slowing down your business?
In today’s rapidly evolving business world, Companies’ needs for monitoring certain key metrics and KPI’s tend to shift around continuously. It is crucial that the Dashboard tools in use are flexible and allow quick modifications with minimal effort – sadly, this is often not the case. Keep reading to find out how to avoid the common mistakes by replacing your out-of-date dashboard tools!
Dashboards are the heart of many Digital Solutions
Most Digital Solutions feature some type of Dashboards in one form or another. Simply put, Dashboards are tools that pull either historical or real-time data from multiple sources at once and visualize it into easily understandable format.
Even though all Digital Solutions revolve around some type of data, it is usually not worth a penny in its raw format. Dashboards enable humans to comprehend huge masses of data with a single glance of a monitor and easily spot anomalies, issues or bottlenecks in processes. If Data is the new oil, then Dashboards are the new Refineries.
Dashboards can also utilize Artificial Intelligence ad Machine Learning in many innovative ways to provide users with deeper insights instead of just visualizing the raw data.

Dashboard tools enable users to make quick conclusions from huge amounts of visualized raw data.
The common challenges with Dashboards
Dashboards are brilliant tools but like most good things, they come with their own set of challenges. The most common challenges companies face when using Dashboards have to do with modifiability and customization.
Every company has its own unique needs and the same type of data is not valuable for everyone. The same principle also applies to different user groups inside a company and even individual users inside those groups. Not everyone wants, needs or is allowed to see certain KPIs and metrics.
In the rapidly evolving business world of today, the needs for certain metrics and KPI’s also tend to shift around continuously. What was the top priority KPI for your business last month might be far less important now. It is crucial that the Dashboard tools in use are flexible and allow quick modifications with minimal effort. Sadly, this is often not the case.
Most Dashboard tools have a set of predefined widgets, views, templates and user groups, but the trouble starts when you want to customize something outside of that selection. Modifying and customizing the dashboard tools can be incredibly complicated and time-consuming.
In many cases, the only way to get customized tools and widgets is to pay the service provider to build them from scratch. With the hourly rates being what they are, this tends to push the price tags of new features to astronomical levels very quickly. And even if you have the money, it doesn’t guarantee anything – some platforms simply do not support the type of features you need.
Tracking Cloud’s Dynamic Dashboards – Real-time visualization of your business everywhere you go
Tracking Cloud’s Dynamic Dashboards offer real-time visualization of your pivotal KPIs wherever you go and whenever you need to see them. The Dynamic Dashboards are designed to be easily modifiable and customizable to visualize data in any form or shape, from any source that is important for your business.
Every user can easily build their own customized views and add whatever widgets they want to see (within their permission levels, of course) or use predefined templates for specific user groups. Easy management of permissions enables you to connect all your stakeholders (employees, customers, customers’ customers, subcontractors, suppliers, vendors, etc.) under one multi-tenant platform and share your valuable information over company boundaries in real-time.
Pick Your Data Sources Freely
Tracking Cloud’s Dynamic Dashboard tools can be connected to any data source, or Data Provider, as they are called in our solutions. The data can be pulled from your existing backend systems like ERPs, CRMs and PLCs or from IoT-enabled sensors. It can be e.g. timestamps, orders statuses, impact shocks, temperatures, humidity, geofencing transactions, etc. With Tracking Cloud™, you can track anything. Read more in our blog: Data-driven Decision-Making with Tracking Cloud™
Superb Usability & Modifiability
High-level usability and modifiability are the cornerstones of Tracking Cloud’s Dynamic Dashboards. Every user can freely modify their personal views within the limits of their user permissions or use pre-defined view templates for different groups (e.g. Sales, Production, Maintenance).
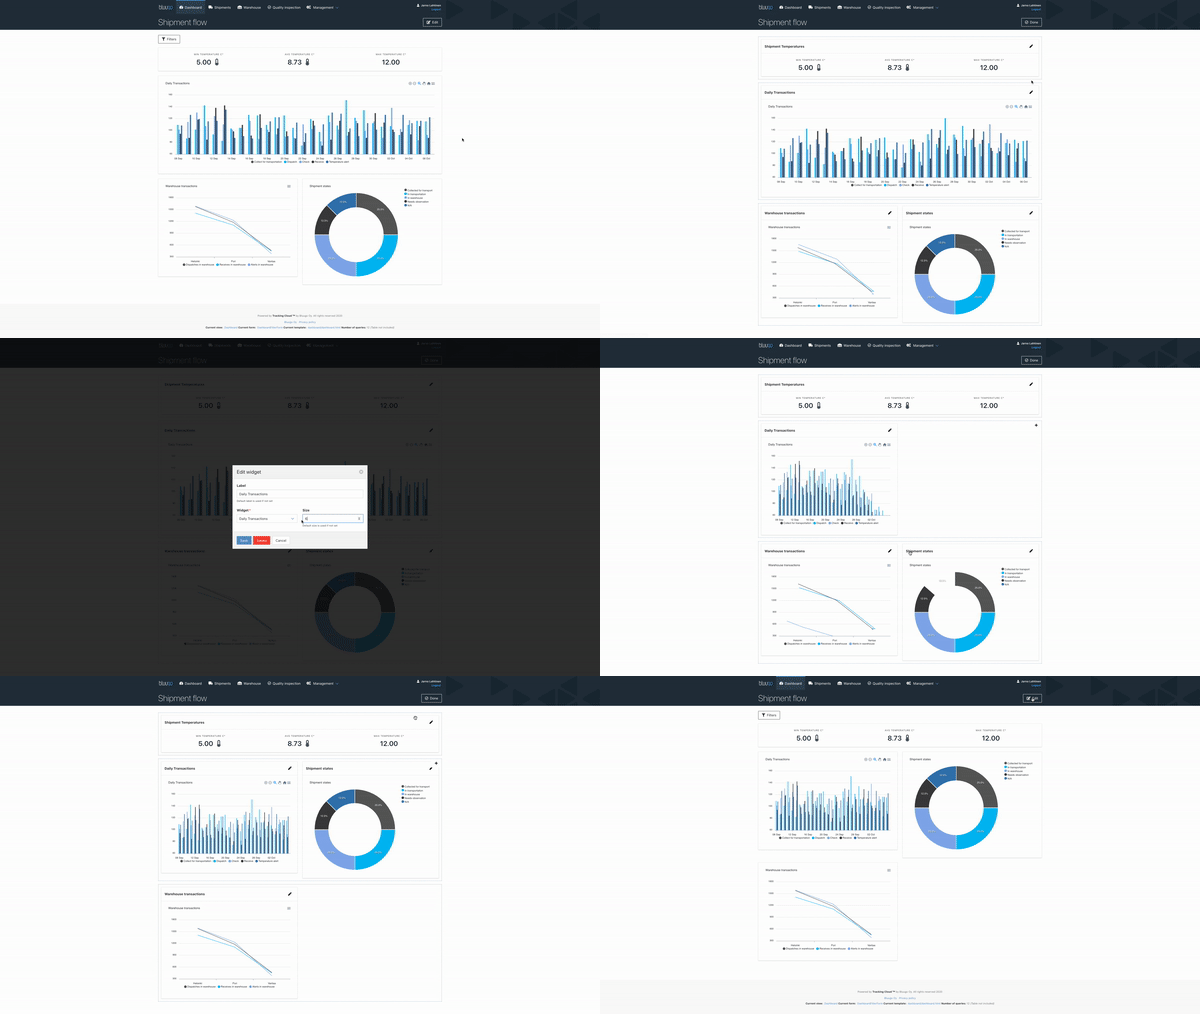
You can add, remove, resize, move and rearrange widgets in a matter of seconds and make sure you’re seeing all the essential information with a single glance of a monitor. You can also modify the visualization of the data in your widgets on-the-go, from pie charts to columns for example.
All widget views can be exported as JPG or SVG images.
Connect All Stakeholders & Share Real-time Data
Tracking Cloud™ is a multi-tenant platform. You can connect all your stakeholders and easily share valuable information over company boundaries with the Dynamic Dashboards.
You can easily create separate Permission Groups for different interest groups like customers, customers’ customers, subcontractors, suppliers, etc. and make sure that users can only access the data they are allowed to see.
We do not charge customers for user licenses, so you can freely connect all your stakeholders. Some of our customers have only a few users, others have thousands – whatever suits you the best.
Real-time visibility with all devices
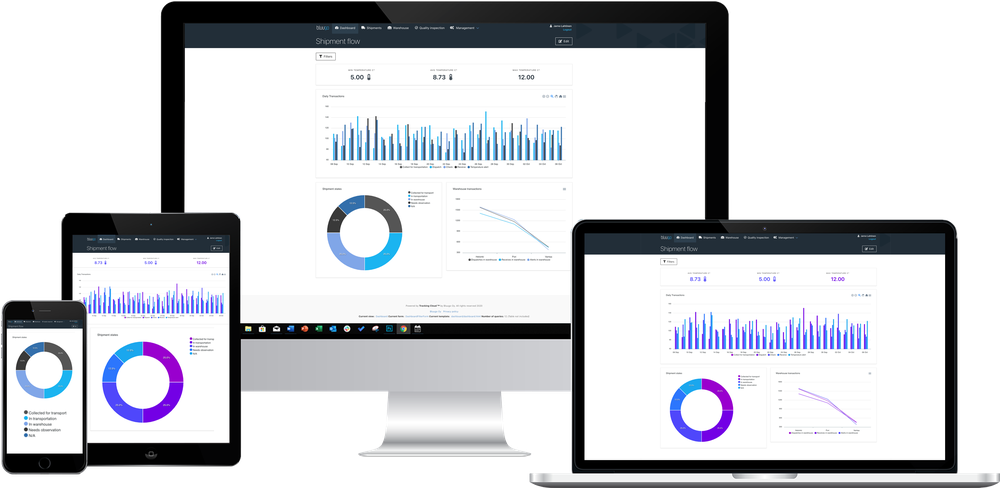
Tracking Cloud’s Dynamic Dashboards work on all devices: desktop computers, laptops, tablets and mobile phones. You can access your important KPIs whenever you need to, wherever you happen to be – at office, on the road or at home laying on the couch!

Ready to see Tracking Cloud™ in action?
We’d be happy to tell you more about the Dynamic Dashboards and other features of our Tracking Cloud™ products. Contact us, and let’s discuss how our solutions could best benefit your business!
